Sunday, December 5, 2010

Dasymetric Map

http://www.uwsp.edu/geo/faculty/ritter/geog101/textbook/essentials/map_types.html

Dasymetric map is a thematic map used to classify volumetric data. This map is used often for population density since it has the ability of realistically place data.

Cartogram

http://www.cbr.washington.edu/papers/jim/draft.html

This above cartogram shows each county in the United States rescaled according to population. The map is distorted to convoy the information in an alternate variable.

Dopplar Radar

http://www.bom.gov.au/weather/radar/about/new_radar_services.shtml

A Doppler radar is able to show the path of a storm and type of precipitation. It can estimate two parameters, reflectivity and rotational velocity.

Cartographic Animations

http://www.wiu.edu/users/cre111/older/CGFinal/paper.htm

Cartographic animations are able to show changes in data in a continues fashion.

Cadastral Map

http://alamedahistory.org/the-map/

Cadastral maps usually help show land or parcel ownership.

Hypsometric Map

http://www.rrcap.unep.org/centralasia/reapreport/map.cfm

Hypsometric maps are used to show differences in elevations in maps and different colors are used to display the differences.

Isohyet

http://www.trc.govt.nz/previous-month-and-year-to-date/

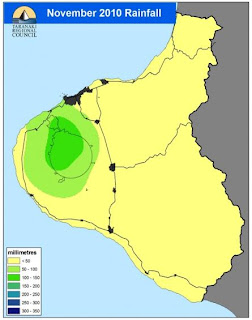
An isohyet uses contour lines to represent the amount of rainfall on a map. Each color in the above map shows the different amount of perception month to data for that location.