Hackney Map
Saturday, December 4, 2010
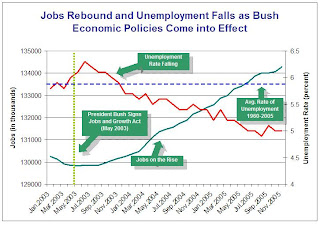
Bilateral Graph
https://blogger.googleusercontent.com/img/b/R29vZ2xl/AVvXsEi-n1jj9ooGjYHGvdhZ9X9hcDAjzdWKeVnDbixVhSCFrMIYY9ByPBHQiKupgHc2QJAiCmHO48zqiCwVIgxf3gEKKTfVQfYTvtRpeFUUxdPDPhaXbhvkCJLSP1iSbZlqFHuNHKp7iybrBEU/s1600-h/Bilateral+Graph.jpg
I was unable to find a bilateral graph that was not already saved to someones blog site. These graphs are used to represent two variables that are related to each other. While one rises the other decreases and this is what can be seen one the graph.
No comments:
Post a Comment
Newer Post
Older Post
Home
Subscribe to:
Post Comments (Atom)
No comments:
Post a Comment